A blog on statistics, methods, philosophy of science, and open science. Understanding 20% of statistics will improve 80% of your inferences.

Wednesday, December 24, 2014

More Data Is Always Better, But Enough Is Enough


[This is a re-post from my old blog, where this appeared March 8, 2014] 

Several people have been reminding us that we need to perform well powered studies. It’s true this is a problem, because low power reduces the informational value of studies (a paper Ellen Evers and I wrote about this, has now appeared in Perspectives on Psychological Science, and is available here). If you happen to have a very large sample, good for you. But here I want to prevent people from drawing the incorrect reverse inference that the larger the sample size you collect, the better. Instead, I want to discuss when it’s good enough.

I believe we should not let statisticians define the word ‘better’. The larger the sample size, the more accurate parameter estimates (such as means and effect sizes in a sample). Although accurate parameter estimates are always a goal when you perform a study, they might not always be your most important goal. I should admit, I’m a member of an almost extinct species that still dares to publically admit that I think Null-Hypothesis Significance Tests have their use. Another (deceased) member of this species was Cohen, but for some reason, 2682 people cite his paper where he argues against NHST, and only 20 people have ever cited his rejoinder where he admits NHST has its use

Let’s say I want to examine whether I’m violating a cultural norm if I walk around naked when I do my grocery shopping. My null hypothesis is no one will mind. By the time I reach the fruit section, I’ve received 25 distressed, surprised, and slightly disgusted glances (and perhaps two appreciative nods, I would like to imagine). Now beyond the rather empty statement that more data is always better, I think it would be wise if I get dressed at this point. My question is answered. I don’t exactly know how strong the cultural norm is, but I know I shouldn’t walk around naked.

Even if you are not too fond of NHST, there are times when your ethical board will stop you from collecting too much data (and rightly so). We can expect our participants to volunteer (or perhaps receive a modest compensation) to participate in scientific research because they want to contribute to science, but their contribution should be worthwhile, and balanced against their suffering. Let’s say you want to know whether fear increases or decreases depending on the brightness of the room. You put people in a room with either 100 or 1000 lux, and show them 100 movie clips from the greatest horror films of all time. Your ethical board will probably tell you that the mild suffering you are inducing is worth it, in terms of statistical power, from participants 50 to 100, but not so much for participants 700 to 750, and will ask you stop when your data is convincing enough.

Finally, imagine a tax payer who walks up to you, hands you enough money to collect data from 1000 participants, and tells you: “give me some knowledge”. You can either spend all the money to perform one very accurate study, or 4 or 5 less accurate (but still pretty informational) studies. What should you do? I think it would be a waste of the tax payers money if you spend all the money on a single experiment. 

So, when are studies informational (or convincing) enough? And how do you know how many participants you need to collect, if you have almost no idea about the size of the effect you are investigating?

Here’s what you need to do. First, determine your SESOI (Smallest Effect Size Of Interest). Perhaps you know you can never (or are simply not willing to) collect more than 300 people in individual sessions. Perhaps your research is more applied, and allows for a cost benefit analysis that requires an effect is larger than some value. Perhaps you are working in a field that does not simply exist of directional predictions (X > Y) but allows for stronger predictions (e.g., your theoretical model predicts the effect size should lie between r = .6 and r = .7).

After you have determined this value, collect data. After you have a reasonable number of observations (say 50 in each condition) analyze the data. If it’s not significant, but still above your SESOI, collect some more data. If (say after 120 participants in each condition) the data is significant, and your question is suited for a NHST framework, stop the data collection, write up your results, and share them. Make sure that, when performing the analyses and writing up the results, you control the Type 1 error rate. That’s very easy, and is often done in other research areas such as medicine. I’ve explained how to do it, and provide step-by-step guides, here (the paper has now appeared in the European Journal of Social Psychology). If you prefer to reach a specific width of a confidence interval, or really like Bayesian statistics, determine alternative reasons to stop the data collection, and continue looking at your data until your goal is reached.

The recent surge of interest in things like effect sizes, confidence intervals, and power is great. But we need to be aware, especially when communicating this to researchers who’ve spend less time reading up on statistics, that we tell them they should change the way they work, without telling them exactly how they should change the way they work. Saying more data is always better might be a little demotivating for people to hear, because it means it is never good enough. Instead, we need to help people to make it as easy as possible to improve the way they work, by giving advice that is as concrete as possible.
Friday, December 19, 2014

Observed power, and what to do if your editor asks for post-hoc power analyses

This blog post is now included in the paper "Sample size justification" available at PsyArXiv.

Observed power (or post-hoc power) is the statistical power of the test you have performed, based on the effect size estimate from your data. Statistical power is the probability of finding a statistical difference from 0 in your test (aka a ‘significant effect’), if there is a true difference to be found. Observed power differs from the true power of your test, because the true power depends on the true effect size you are examining. However, the true effect size is typically unknown, and therefore it is tempting to treat post-hoc power as if it is similar to the true power of your study. In this blog, I will explain why you should never calculate the observed power (except for blogs about why you should not use observed power). Observed power is a useless statistical concept, and at the end of the post, I’ll give a suggestion how to respond to editors who ask for post-hoc power analyses.

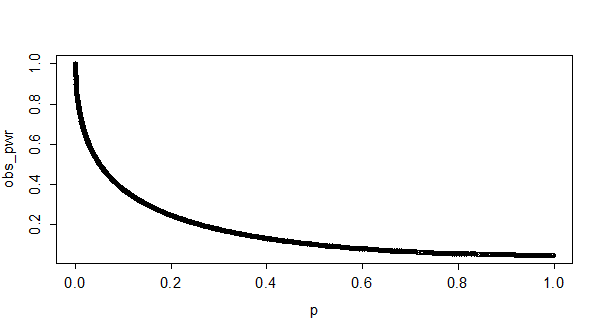
Observed (or post-hoc) power and p-values are directly related. Below, you can see a plot of observed p-values and observed power for 10000 simulated studies with approximately 50% power (the R code is included below). It looks like a curve, but the graph is basically a scatter plot of a large number of single observations that fall on a curve expressing the relation between observed power and p-values.


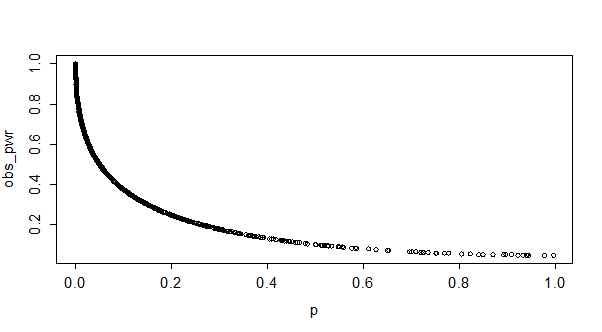
Below, you see a plot of p-values and observed power for 10000 simulated studies with approximately 90% power. Yes, that is exactly the same curve these observations fall on. The only difference is how often we actually observe high p-values (or have low observed power). You can see there are only a few observations with high p-values if we have high power (compared to medium power), but the curve stays exactly the same. I hope these two figures drive home the point of what it means that p-values and observed power are directly related: it means that you can directly convert your p-value to the observed power, regardless of your sample size or effect size.  

 
Let’s draw a vertical line at p = 0.05, and a horizontal line at 50% observed power. We can see below that the two lines meet exactly at the line visualizing the relationship between p-values and observed power. This means that anytime you observed a p-value of p = 0.05 in your data, your observed power will be 50% (in infinite sample sizes, in t-tests - Jake Westfall pointed me to this paper showing the values at smaller samples, and for F-tests with different degrees of freedom).


I noticed these facts about the relationship between observed power and p-values while playing around with simulated studies in R, but they are also explained in Hoenig& Heisey, 2001.

Some estimates (e.g., Cohen, 1962) put the average power of studies in psychology at 50%. What observed power can you expect, when you perform a lot of studies which have a true power of 50%? We know that the p-values we can expect should be split down the middle, with 50% being smaller than p = 0.05, and 50% being larger than p = 0.05. The graph below gives the p-value distribution for 100000 simulated independent t-tests:


The bar on the left are all (50.000 out of 100.000) test results with a p < 0.05. The observed power distribution is displayed below:


It is clear you can expect just about any observed power when the true power of your experiment is 50%. The distribution of observed power changes from positively skewed to negatively skewed as the true power increases (from 0 to 1), and when power is around 50% we observe a tipping point where there is a switch from a negatively skewed distribution to a positively skewed distribution. With slightly more power (e.g., 56%) the distribution becomes somewhat U-shaped, as can be seen in the figure below. I’m sure a mathematical statistician can explain the why and how of this distribution in more detail, but here I just wanted to show what it looks like, because I don’t know of any other sources of information where this distribution is reported (thanks to a reader, who in the comments points out Yuan & Maxwell, 2005 also discuss observed power distributions).


Editors asking for post-hoc power analyses

Editors sometimes ask researchers to report post-hoc power analyses when authors report a test that does not reveal a statistical difference from 0, and when authors want to conclude there is no effect. In such situations, editors would like to distinguish between true negatives (concluding there is no effect, when there is no effect) and false negatives (concluding there is no effect, when there actually is an effect, or a Type 2 error). As the preceding explanation of post-hoc power hopefully illustrates, reporting post-hoc power is nothing more than reporting the p-value in a different way, and will therefore not answer the question editors want to know.

Because you will always have low observed power when you report non-significant effects, you should never perform an observed or post-hoc power analysis, even if an editor requests it (feel free to link to this blog post). Instead, you should explain how likely it was to observe a significant effect, given your sample, and given an expected or small effect size. Perhaps this expected effect size can be derived from theoretical predictions, or you can define a smallest effect size of interest (e.g., you are interested in knowing whether an effect is larger than a ‘small’ effect of d < 0.3).

For example, if you collected 500 participants in an independent t-test, and did not observe an effect, you had more than 90% power to observe a small effect of d = 0.3. It is always possible that the true effect size is even smaller, or that your conclusion that there is no effect is a Type 2 error, and you should acknowledge this. At the same time, given your sample size, and assuming a certain true effect size, it might be most probable that there is no effect.

Wednesday, December 10, 2014

Psychology Journals Should Make Data Sharing A Requirement For Publication


Psychology journals should require, as a condition for publication, that data supporting the results in the paper are accessible in an appropriate public archive.

I hope that in the near future, the ‘should’ in the previous sentence will disappear, and that data sharing has become a requirement. Many journals already have requirements to share data, but often not in a public database. For example, if you want to publish in Nature:

A condition of publication in a Nature journal is that authors are required to make materials, data, code, and associated protocols promptly available to readers without undue qualifications. Any restrictions on the availability of materials or information must be disclosed to the editors at the time of submission. Any restrictions must also be disclosed in the submitted manuscript.

But even if researchers might be willing to follow such requirements, research shows that it becomes more and more difficult to make data available, as time passes.

Many (85, to be exact) journals have signed DRYAD’s Joint Data Archiving Policy, which does require data to be shared in a public database (and thus stay accessible as time passes). The journals most relevant for psychologists are probably PLOS ONE, the Journal of Consumer Research, and Philosophical Transactions of the Royal Society B. The JDAP states that:

[Journal] requires, as a condition for publication, that data supporting the results in the paper should be archived in an appropriate public archive, such as [list of approved archives here]. Data are important products of the scientific enterprise, and they should be preserved and usable for decades in the future. Authors may elect to have the data publicly available at time of publication, or, if the technology of the archive allows, may opt to embargo access to the data for a period up to a year after publication. Exceptions may be granted at the discretion of the editor, especially for sensitive information such as human subject data or the location of endangered species.

Exceptions may be granted, but should be explained to the editor when submitting a manuscript. If we look at other disciplines, such as economics, we see people are able to share quite a bit when publishing an article. For example (and this is a completely random pick) in a recent issue of Science (who, just like Nature, did not sign JDAP, but developed their own regulations about data sharing) Sara B. Heller explains how summer jobs reduce violence among disadvantaged youth. Obviously, it’s important to maintain confidentiality when sharing such data, but this is manageable, as we see:

Replication data are posted at the University of Michigan’s ICPSR data depository (http://doi.org/10.3886/E18627V1); see supplementary materials section 1.5 for details.

Here’s the direct link to the read me file of her data: http://www.openicpsr.org/repoEntity/show/20113

If we want science to be cumulative, we need to share our data and materials. This requires extra work and new knowledge about data sharing procedures, which makes it unlikely that the majority of psychologists will make the effort to share data, unless they are required to do so. It is therefore the responsibility of editors at psychology journals to either sign JDAP, or develop their own data sharing requirements.

It is clear the norms around data sharing are quickly changing, aided by technological developments that enable sharing data and materials. Psychology as a discipline seems to me to be lagging behind a little bit. This is not too problematic, because change can be quick and relatively effortless. Almost all universities will have experts that can assist researchers in sharing their data (these are typically surprisingly friendly and knowledgeable people. Our expert at the TU Eindhoven, Leon Osinski, is so nice, he doesn't even mind if you send him an e-mail if he can help you). From 2016 onward, I plan to spend my reviewing time on articles that share materials and data, in line with the data sharing policies at journals like The American Journal of Botany (and many, many others). But 2015 has 365 days to implement data sharing requirements in all psychology journals. So let’s make this our New Year’s resolution.