[Now with update for STATA by my colleague +Chris Snijders]
[Now with update about using the MBESS package for within-subject designs]
[Now with an update on using ESCI]
Confidence intervals are confusing intervals. I have nightmares where my students will ask me what they are, and then I try to define them, and I mumble something nonsensical, and they all point at me and laugh.
Luckily, I
have had extensive training in reporting
statistics I don’t understand completely when I studied psychology, so when it comes to
simply reporting confidence intervals, I’m fine. Although these calculations
are really easy to do, for some reason I end up getting a lot of e-mails about
them, and it seems people don’t know what to do to calculate confidence
intervals for effect sizes. So I thought I’d write one clear explanation, and
save myself some time in the future. I’ll explain how to do it in 2 ways, the first
using SPSS, the second using R, the third by my colleague Chris Snijders on using Stata, and some brief comments about using ESCI.
CI for eta-squared in SPSS
First, download CI-R2-SPSS.zip
from the website of Karl L Wuensch.
His website is extremely useful (the man deserves an award for it) especially
for the step-by-step guides he has created. The explanations he has written to
accompany the files are truly excellent and if this blog post is useful, credit
goes to Karl Wuensch.
This example focusses on designs where all factors in your
ANOVA are fixed (e.g., manipulated), not random (e.g., measured), in which case
you need to go here.
All you need to do is open NoncF.sav (which refers to the non-central F-distribution, for an introduction, see
the OSC
blog), fill in some numbers in SPSS, and run a script. You’ll see an empty
row of numbers, except .95 in the conf column (which happens to be a value you
probably don’t want to use, see the end of this post).

Let’s say you have the following in your results section: F(1,198) = 5.72. You want to report
partial η² and a confidence interval around it. You type in the F-value 5.72 in the first column, and
then the degrees of freedom (1 in the second column, 198 in the third), and you
change .95 into .90 (see below for the reason). Then, you just open NoncF3.sps,
run the script, and you get the output in the remaining columns of your SPSS
file:

We are only interested in the last three columns. From the
r2 column, we get r² or η², = .028, with the lower (lr2) and
upper (ur2) values of the confidence interval to the right that give us 90% CI
[.003; .076]. Easy peasy.
CI for eta-squared in R (or R Studio)
I’m still not very good with R. I use it as a free
superpowered calculator, which means I rarely use it to analyze my data (for
which I use SPSS) but I use it for stuff SPSS cannot do (that easily). To
calculate confidence intervals, you need to install the MBESS package
(installing R, Rstudio and MBESS
might take less time than starting up SPSS, at least on my computer).
To get the confidence interval for the proportion of
variance (r², or η², or partial η²) in a
fixed factor analysis of variance we need the ci.pvaf function. MBESS has loads
more options, but you just need to copy paste and run:
ci.pvaf(F.value=5.72, df.1=1, df.2=198, N=200, conf.level=.90)
This specifies the F-value,
degrees of freedom, and the sample size (which is not needed in SPSS), and the
confidence level (again .90, and not .95, see below). You’ll get the following
output:
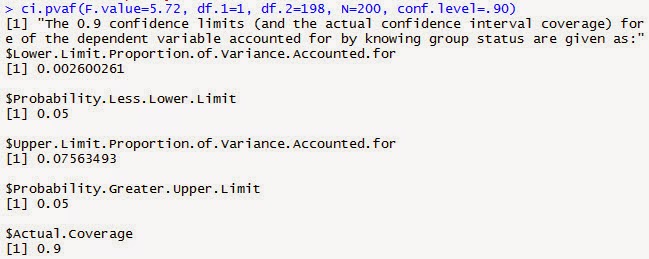
Here we see the by now familiar lower limit and upper limit
(.003 and .076). Regrettably, MBESS doesn’t give partial η², so you need to
request it in SPSS (or you can use my effect
size spreadsheet).
I found out that for within designs, the MBESS package returns an error. For example:
Error in ci.pvaf(F.value = 25.73, df.1 = 2, df.2 = 28, N = 18, conf.level = 0.9) : N must be larger than df.1+df.2
This error is correct in between-subjects designs (where the sample size is larger than the degrees of freedom) but this is not true in within-designs (where the sample size is smaller than the degrees of freedom for many of the tests). Thankfully, Ken Kelley (who made the MBESS package) helped me out in an e-mail by pointing out you could just use the R Code within the ci.pvaf function and adapt it. The code below will give you the same (at least to 4 digits after the decimal) values as the Smithson script in SPSS. Just change the F-value, confidence level, and the df.1 and df.2.
UPDATE
I found out that for within designs, the MBESS package returns an error. For example:
Error in ci.pvaf(F.value = 25.73, df.1 = 2, df.2 = 28, N = 18, conf.level = 0.9) : N must be larger than df.1+df.2
This error is correct in between-subjects designs (where the sample size is larger than the degrees of freedom) but this is not true in within-designs (where the sample size is smaller than the degrees of freedom for many of the tests). Thankfully, Ken Kelley (who made the MBESS package) helped me out in an e-mail by pointing out you could just use the R Code within the ci.pvaf function and adapt it. The code below will give you the same (at least to 4 digits after the decimal) values as the Smithson script in SPSS. Just change the F-value, confidence level, and the df.1 and df.2.
CI for Cohen’s d in SPSS
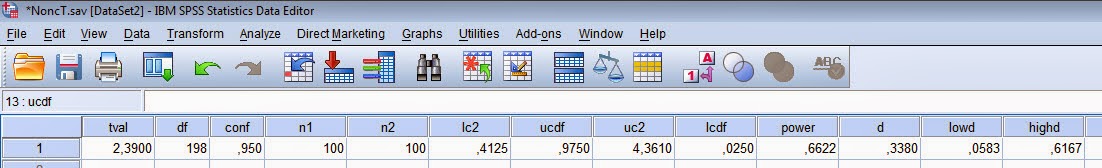
Karl Wuensch adapted the files by Smithson (2001) and created a zip file to compute effect sizes around Cohen’s d which works in almost the same way as the calculation for confidence intervals around eta-squared (except for a dependent t-test, in which case you can read more here or here). Open the file NoncT.sav. You’ll again see an almost empty row where you only need to fill in the t-value and the degrees of freedom. Note that (as explained in Wuensch’s help file) there’s a problem with the SPSS files if you fill in a negative t-value, so fill in a positive t-value, and reverse the signs of the upper and lower CI if needed.

If you have a t-test
that yielded t(198) = 2.39, then you
fill in 2.39 in the first column, and 198 in the second column. For a
one-sample t-test this would be
enough, in a two-sample t-test you
need to fill in the sample sizes n1 (100 participants) and n2 (100
participants). Open T-D-2samples.sps and run it. In the last three columns, we
get Cohen’s d (0.33) and the upper
and lower limits, 95% CI [0.06, 0.62].
CI for Cohen’s d in R
In MBESS, you can calculate the 95% confidence interval
using:
ci.smd(ncp=2.39, n.1=100, n.2=100, conf.level=0.95)
The ncp (or non-centrality parameter) sounds really scary,
but it’s just the t-value (in our
example, 2.39). n.1 and n.2 are the samples sizes in both groups. You’ll get
the following output:
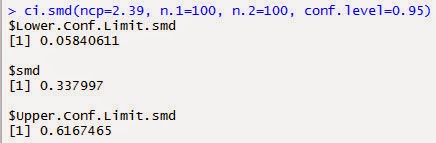
Yes, that’s really all there is to
it. The step-by step guides by Wuensch, and the help files in the MBESS package
should be able to help you if you run into some problems.
Why should you report 90% CI for eta-squared?
ESCI update
For people who prefer to use ESCI software by Cumming, please note that ESCI also has an option to provide 95% CI around Cohen's d, both for independent as for dependent t-tests. However, the option is slightly hidden - you need to scroll to the right, where you can check a box which is placed out of view. I don't know why such an important option is hidden away like that, but I've been getting a lot of e-mails about this, so I've added a screenshot below to point out where you can find it. After clicking the check box, a new section appears on the left that allows you to calculate 95% CI around Cohen's d (see second screenshot below)


Why should you report 90% CI for eta-squared?
Again, Karl Wuensch has gone out of his way to explain this in a very clear document, including examples, which you can find here. If you don’t want to read it, you should know that while Cohen’s d can be both positive and negative, r² or η² are squared, and can therefore only be positive. This is related to the fact that F-tests are always one-sided (so no, don’t even think about dividing that p = .08 you get from an F-test by two and reporting p = .04, one-sided). If you calculate 95% CI, you can get situations where the confidence interval includes 0, but the test reveals a statistical difference with a p < .05. For a paper by Steiger (2004) that addresses this topic, click here. This means that a 95% CI around Cohen's d equals a 90% CI around η² for exactly the same test. Furthermore, because eta-squared cannot be smaller than zero, a confidence interval for an effect that is not statistically different from 0 (and thus that would normally 'exclude zero') necessarily has to start at 0. You report such a CI as 90% CI [.00; .XX] where the XX is the upper limit of the CI.
@Stata afterburner - a confidence
interval around eta-squared
by
Chris Snijders
In
the fall semester I will be teaching a statistics class with Daniel. I have
sleepless nights already about what that will do to my evaluations – who wants
to appear old and retarded next to such youthful brilliance? [Note that Chris has little to worry about - he was chosen as the best teacher at Eindhoven University of Technology a few years ago - DL]. As Daniel is SPSS
and R, and I am just Stata, this also implies some extra work: trying to
translate Daniel’s useful stuff to Stata - our students have had their basic
course in Stata and I want them to be able to keep up. Luckily, in the case of (confidence
intervals around) eta-squared I have an easy way out: Stata 13 includes several
effect size measures by default.
The
below example is heavily “inspired” by the Stata manual. It shows how to get
eta-squared and its confidence interval in Stata. First, read in your data. I
use the standard apple data set from Stata:
use http://www.stata-press.com/data/r13/apple
The
details of the data do not matter here. Running an Anova goes like this:
anova weight treatment (output omitted)
To
get eta-squared and its confidence interval, type
estat esize
to
get
Effect sizes for linear
models
-------------------------------------------------------------------
Source | Eta-Squared df
[95% Conf. Interval]
--------------------+----------------------------------------------
Model | .9147383 3
.4496586 .9419436
|
treatment | .9147383 3
.4496586 .9419436
-------------------------------------------------------------------
If
you insist on 90% confidence interval, as does Daniel, type:
estat esize, level(90)
Voila!
Stata
does several additional things too, such as calculating bootstrapped confidence
intervals if you prefer, or calculate effect sizes directly.
Useful
additional info can be found at
http://www.stata.com/stata13/effect-sizes/,
or try the YouTube intro at https://www.youtube.com/watch?v=rfn5FY96BMc
(using the ugly windowed interface).
ESCI update
For people who prefer to use ESCI software by Cumming, please note that ESCI also has an option to provide 95% CI around Cohen's d, both for independent as for dependent t-tests. However, the option is slightly hidden - you need to scroll to the right, where you can check a box which is placed out of view. I don't know why such an important option is hidden away like that, but I've been getting a lot of e-mails about this, so I've added a screenshot below to point out where you can find it. After clicking the check box, a new section appears on the left that allows you to calculate 95% CI around Cohen's d (see second screenshot below)
Conclusion
I think you should report confidence intervals because
calculating them is pretty easy and because they tell you something about the
accuracy with which you have measured what you were interested in. Personally,
I don’t feel them in the way I feel p-values,
but that might change. Psychological Science is pushing confidence intervals as
‘new’ statistics, and I’ve seen some bright young minds being brainwashed to
stop reporting p-values altogether
and only report confidence intervals.
I’m pretty skeptical about the likelihood this will end up being an
improvement. Also, I don’t like brainwashing. More seriously, I think we need
to stop kidding ourselves that statistical inferences based on a single
statistic will ever be enough. Confidence intervals, effect sizes, and p-values (all of which can be calculated
from the test statistics and degrees of freedom) present answers to different
but related questions. Personally, I think it is desirable to report as many statistics that are relevant to your research question as possible.
Smithson, M. (2001). Correct
confidence intervals for various regression effect sizes and parameters: The
importance of noncentral distributions in computing intervals. Educational
And Psychological Measurement, 61(4), 605-632. doi:10.1177/00131640121971392
Hi Daniel,
ReplyDeleteas always I'm not satisfied. Consider this as a question from a grad student in the first row :)
The computation you outline is all nice and good but how do I interpret the effect size? how do I interpret the eta^2 in particular? What am I supposed to write in my paper.
Consider a study which varies the room temperature and measures the reaction time in a visual detection task. We have four groups with temperature 20,22,24,26 degrees. We perform an Anova and discover that eta^2 is 0.28 with [.03; .76] CI. How am I supposed to interpret this quantity? You tell me about intuition building. But is not quantitative analysis supposed to be objective? What if other researcher builds different intuition than I did? Do we need standards/rules? What will they look like?
Actually, some insight can be gained by considering the computation of eta^2. This is SS of the temperature divided by total SS. But wait, this means that the effect size can be artificially bloated. We just need to increase the variance due to temperature. We can do this by adding levels to our manipulation (e.g. another group with 18 deg). Or by spacing the groups further apart (e.g. 15,20,25,30 deg). So it seems we need different intuition/rules for different designs, different number of levels and in fact different choice of group spacing. This is an overkill. If don't think this can work.
My solution is to avoid any standardized (and especially squared) quantities and provide estimates of causal effects. In the above case we are interested in the regression coefficient that predicts reaction time from temperature. Then I can say that the reaction time increases by 40 [10,70] CI ms per degree Celsius. Why can't we report this? Any layman understands this quantity and the CI. We don't need any special intuitions/rules. This quantity is independent of the number of groups and the temperature spacing.
Once we set the estimation of causal effects as the goal of our analysis, p-values and hypothesis testing becomes redundant and can be disposed of without loss. I encourage everyone to do this.
Hi Matus, keep your comments coming, they're great! You are right that standardized effect sizes are less interesting when you can interpret scales in a meaningful manner. In psychology, this is sometimes difficult. What does the difference between 5 and 6 on a 7-point scale measuring self-confidence mean?
DeleteMoreover, if you want to compare theoretically similar effects, measured using different paradigms, standardized effect sizes help. We don't have fixed scales we are measuring on (like temperature). That's why meta-analyses practically always use standardized effect sizes.
That's not to say this situation is desirable. it's just difficult to change. Someone once pointed me to Rasch models as a preferable alternative : https://www.researchgate.net/publication/45185202_Effect_sizes_can_be_misleading_is_it_time_to_change_the_way_we_measure_change?ev=prf_pub. However, I'm not too good at Rasch models.
Also, people have remarked we should only use estimation, but that argument has (I think) successfully been countered (e.g., http://www.ejwagenmakers.com/inpress/MoreyEtAlPsychScienceInPress.pdf).
"What does the difference between 5 and 6 on a 7-point scale measuring self-confidence mean?" Self-confidence is a psychological construct and on it's own it doesn't mean anything. Rather it provides a (causal) link between the actual quantities. If study A shows an increase of self-confidence by 0.2 points due to treatment and study B shows that increase in self-confidence by 1 point decreases the BDI score (depression) by 50 %, then we can say that treatment decreases the BDI score by 10%. This of course means that study A and B use the same tool to measure self-confidence. That's why clinicians developed standardized tools such as BDI and DSM - if every researcher uses different tool to measure the success of treatment how should we compare the different treatments? Researchers need to invest time to develop reliable and valid tools if they wish to introduce some psychological construct. Otherwise we can't really say what they are measuring.
ReplyDeleteI've saw the comment by Morey et al. (There is also a response by Cumming somewhere already.) I remain unconvinced. Actually I'm currently summing my view in a blog post that will target their criticism. Though, I think Morey et al. are right when they say that new statistics implies abandonment of hypothesis testing. This is a bullet that Cumming et al. will have to bite at some later point if they want to remain true to their principles.
In general, a criticism of estimation in press is rare (although I can imagine it is rampant behind the scenes), so if you know more such cases just throw it at me. Thanks!
Sorry, that was meant as response to Daniel, June 7, 2014 at 6:03 AM
DeleteI think you linked the CI for Cohen’s d in SPSS zip to your local folder instead of where it's hosted online!
ReplyDeleteThanks! Must be due to the fact I prepared it in Word - was wrong in 3 other places, fixed them all now I hope. Thanks for letting me know.
DeleteThis comment has been removed by the author.
ReplyDeleteHi Daniel, nice post. Just a suggestion: there is nothing wrong in dividing by 2 the p.value of the F test and report it one-side, if one knowns what s/he is doing and explain why.
ReplyDeletecheers
Hi Daniel,
ReplyDeleteI'm just wondering if any these programs can calculate effect sizes/95% CIs for planned contrasts? My research question is not concerned with the overall one-way ANOVA.
Thank you,
Lisa
Hi Lisa, I'm pretty sure you have either an F-test or t-test. So see above.
DeleteOk thanks. Appreciate the re-assurance that I am in the right place!
DeleteHi Daniel,
ReplyDeleteFirst of all, congratulation (and thanks) for the interesting and very useful work on methods and stats that you have been producing. Your effect sizes spreadsheets are lifesaving.
So, I have question regarding the ESCI software and the calculation of the 95% CI around Cohen's d (one sample): I can't even find the ESCI module where I can preform this. I searched in all the modules (at least I believe I did) and can't find nothing that looks like the screenshot you have above. Can you please tell me where I can ask for this? Basically I would like to calculate the 95% CI around Cohen's dz, for my results vs. published results.
Thanks for taking the time to reply.
Best,
Tomás Palma
Hi, ESCI does not do a one-sample t-test. I'm not sure if it is formally correct to do a dependent t-test, but set all the values in the second condition to 0 - I think that should work, but I think you should be able to see if it works. Let me know if it does.
DeleteHi Daniel,
ReplyDeleteThanks for the fast reply. Let me give you a bit more of details because I now realize that maybe my question was not very clear. What I have is a 2x3 repeated measures design and I'm testing for differences between specific pairs of cells via contrasts. I read in your paper (Lakens, 2013, p. 8, Frontiers in Psych) that the Cohen's dz 95% CI can be calculated with the ESCI (Cumming and Finch, 2005). I downloaded the ESCI module that accompanies the paper Cumming's paper but I can't find the options to calculate this CI. I calculated the Cohen's dz (and other effect sizes) in your spreadsheet but I would like to have the CI too.
Thanks again!
Tomás
Hi Daniel,
ReplyDeleteThank you for the great blog! Do you know if there is a way to calculate CI around Cramer's V. I looked at the MBESS package and there is a function conf.limits.nc.chisq but it doesn't work for me (says effect size too small). Chisq = 2.39, N=66, 2x2. Any suggestions what I should do?
Nikki
Hi
ReplyDeleteThis is really interesting. I am a little in the dark about the CIs around the effect in the repeated-measures example. Given that eta square and partial eta square are different what is it exactly that CI is respect to.
Thanks in anticipation,
Philip.
the CI is around partial eta squared.
DeleteThe ci.smd() can only really be used for between-subject design. It is simple to use however my data is within-subjects. For the life of me I cannot find how to calculated the CI around Cohen's D for within-subject (paired) data. Is there any adjustment to the ci.smd that can be made?
ReplyDeleteRegards
stef
Hi, check out my code here for how I calculate CI for a within design using MBESS in R: https://github.com/Lakens/perfect-t-test/blob/master/Perfect_dependent_t-test.Rmd
DeleteThis comment has been removed by the author.
DeleteDear Daniel,
DeleteThank you for this informative page! it really helps make things clearer.
Regarding the question mentioned here about within-subject designs; I found that when I calculate Cohen's d using the MBESS package, as you suggested, I get the value of the effect size you termed "Cohen's d average" which is not influenced by the correlation between my paired observations (I used the "effect size calculation" spreadsheet attached to your great Frontiers in Psychology paper from 2013). So, I assume this is how they calculate Cohen d in the package (right?).
Do you think its ok to report this value? or should i try to convert it in someway to a within-design?
This is how I performa the calculation in R:
cohend <- smd (Mean.1=mean_group1, Mean.2=mean_group2, s.1=sd_group1, s.2=sd_group2, n.1=23, n.2=23)
ci.smd (smd=cohend, n.1=23, n.2=23, conf.level=.95)
Thank you!!
Hi Daniel, thanks for this page. I'm trying to learn about the CI's. Just to make sure I'm doing the right things: 1) don't look at the LL and UL's SPSS provides, because these refer to means and differences between the means, while the LL and UL's for the effects sizes are something completely different. 2) Not all parameters, e.g., the observed power, will perfectly overlap between the F-test results in SPSS and the results from the Weunsch syntax, because the former is based on the .05 alpha level, and the latter is based on the 90%CI.
ReplyDeleteRegards, and thanks for the help,
Tom
This comment has been removed by the author.
ReplyDeletehi Daniel, Thank you for this wonderful page. I had a problem while running the syntax, it gives me this:
ReplyDelete>Error # 4070. Command name: END IF
>The command does not follow an unclosed DO IF command. Maybe the DO IF
>command was not recognized because of an error. Use the level-of-control
>shown to the left of the SPSS Statistics commands to determine the range of
>LOOPs and DO IFs.
>Execution of this command stops.
I used the syntax before and it run well, I don't know whats wrong this time, can you please help? Thanks a lot!
Vicki
Hi, Daniel, Thank you for keep updating this post.
ReplyDeleteYou mentioned that for with-in subject design, the code of MBESS give the confidence interval of ANOVA was same as Smithson script in SPSS. But Smithson's script calculated the CI for partial eta squared, instead of generalized eta squared (I have check it by using you excel sheet).
So this means that for the generalized eta squared of repeated-measure ANOVA, we still have no idea how to calculated it ?
Hi, indeed, I don't have the formula's for generalized eta-squared (although you should use omega squared! http://daniellakens.blogspot.nl/2015/06/why-you-should-use-omega-squared.html). It's on my to do list, but CI are not a priority for me at the moment.
DeleteHi, Daniel, Thank you for your reply and link!
DeleteHello-
ReplyDeletePardon my ignorance. I have a partial eta2 of .014, and CI ranging from .00 to .016. This asymmetry seems weird. Did I mess up? The reviewers thought so.
Hello Daniel,
ReplyDeleteFirst of all, thanks a lot for your efforts to help people with their statistical problems. I think that both this blog and your publications (especially your 2013 paper on effects sizes) are extremely helpful.
I have the following question: I calculated a 2 x 4 x 3 x 3 MANOVA with two within-subject factors and two between-subjects factors. Importantly, I only have one dependent variable. So I could have calculated a mixed-design ANOVA as well, but I decided to use the multivariate tests (Pillai's trace) provided by SPSS to circumvent the problem of violated sphericity.
Can the packages you describe above (CI-R2-SPSS and MBESS) also calculate confidence intervals around partial eta squared in my MANOVA design or are these algorithms limited to ANOVAs?
Best regards,
Benedikt
Great post.
ReplyDeleteHi, thank you very much for this page, this is very helpful!
ReplyDeleteI used the SPSS script to calculate the CIs for eta squared in a MANOVA.
However, in some cases, mostly for the main effects in the MANOVA, I obtained an eta squared that was not covered by the CI: For instance I had F (34, 508) = 1.72, partial η2 =.103, 90% CI = [.012; .086].
Is it possible that the multivariate design causes the problem here? And would you have any suggestions on how to fix this?
Thanks a lot and best regards,
Tabea
>(so no, don’t even think about dividing that p = .08 you get from an
ReplyDelete>F-test by two and reporting p = .04, one-sided)
https://twitter.com/doinkboy/status/1280820213647368204?s=20
¯\_(ツ)_/¯