See our paper on this topic: Delacre, M., Lakens, D., & Leys, C. (2017). Why Psychologists Should by Default Use Welch’s t-test Instead of Student’s t-test. International Review of Social Psychology, 30(1). https://doi.org/10.5334/irsp.82
New preprint explaining why Hedges’ g*s based on the non-pooled standard deviation should be reported as the effect size alongside Welch’s t-test, with Shiny app and R package to perform the calculations: https://psyarxiv.com/tu6mp/
Take home message of this post: We should use Welch’s t-test by default, instead of Student’s t-test, because Welch's t-test performs better than Student's t-test whenever sample sizes and variances are unequal between groups, and gives the same result when sample sizes and variances are equal. A widely recommended approach in textbooks where you first test the assumption that variances are equal with Levene’s test is a waste of time – just always use Welch’s t-test. Levene’s test often has low power, and will therefore fail to reject the null-hypothesis that variances are equal (even when variances differ), which makes it problematic to accept the null hypothesis of equal variances.
Take home message of this post: We should use Welch’s t-test by default, instead of Student’s t-test, because Welch's t-test performs better than Student's t-test whenever sample sizes and variances are unequal between groups, and gives the same result when sample sizes and variances are equal. A widely recommended approach in textbooks where you first test the assumption that variances are equal with Levene’s test is a waste of time – just always use Welch’s t-test. Levene’s test often has low power, and will therefore fail to reject the null-hypothesis that variances are equal (even when variances differ), which makes it problematic to accept the null hypothesis of equal variances.
Less work
is always better. Here, I’ll explain how you can replace interpreting two
statistical tests (Levene’s test for the equality of variances and Student’s t-test for differences between groups),
by one test: Welch’s t-test (also
known as the Satterwaite’s test, or the Smith/Welch/Satterwaite test, or the
Aspin-Welch test, or the unequal variances t-test).
Levene’s
test is used to test for one of the assumptions of a t-test, namely that the variances of the two populations are equal.
If sample sizes in both conditions are equal, the t-test is very robust against unequal variances. If sample sizes
are unequal, unequal variances can influence the Type 1 error rate of the t-test by either increasing or
decreasing the Type 1 error rate from the nominal (often 0.05) alpha level.
The R code below examines the Type 1 error rate of a hypothetical study where
38 participants were assigned to condition X, and 22 participants were assigned
to condition Y. The mean score on some DV in both groups is the same (e.g., 0), so there is no effect, but the standard deviations between groups differ, with the SD in condition X
being 1.11, and the SD in condition Y being 1.84. So are the sample sizes in
this hypothetical example unequal enough to lead to concern? Are the variances
in these groups (the standard deviations, squared) different enough to cause
bias?
I've simulated 50000 studies (which takes a while, so the number of simulations in the script is set to 5000 instead), where the R code performs a Student’s t-test
(in R specified with the argument var.equal=TRUE), a Welch’s t-test (in R actually the default (!)
but also specified with the argument var.equal=FALSE), and Levene’s test, and
stores the p-values for these three
tests. It then plots the p-value distributions, creates a scatterplot, and calculates the power of Levene's test. We should observe a uniform distribution of p-values because the null-hypothesis is true, with 5% of the p-values being smaller than 0.05, even
though there is no true effect.
It is clear
that this is not the case for Student’s t-test.
We see a skewed distribution, with more p-values below 0.05 than there should
be (in this example, the true Type 1 error rate is 8.4%, which is already far enough from the nominal 5% level to be problemantic).

Welch’s t-test doesn’t flinch, and performs just
as desired.

We can plot
the p-values against each other. Dots fall on the red line when both tests return the same p-value. If the two group sizes are equal, all points fall on this
line. Remember unequal variances are only a problem when group sizes are
unequal. The top left quadrant are all p-values
smaller than 0.05 according to a Student’s t-test,
but higher than 0.05 according to Welch’s t-test.
Since Welch’s t-test maintains the
nominal Type 1 error rate with unequal variances, the p-values in this quadrant represent the bias in Student’s t-test when groups are unequal and
variances are unequal (i.e., the studies that yield a p < .05 with Student's t-test, but not with Welch's t-test).
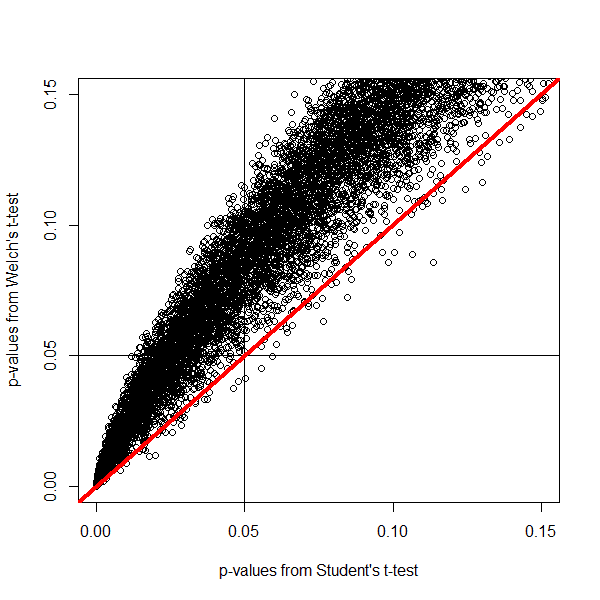
The bias
works both ways. In the example above, the condition with the larger sample
size had the smallest standard deviation. But when the condition with the
larger sample size has the larger standard deviation, the Student’s t-test can return a p-value higher than 0.05, when Welch’s t-test returns a p-value
smaller than 0.05 (there is a dip in the number of p-values < 0.05 in the p-value distribution of Student’s t-test, and the majority of the data
points fall below the red diagonal line).
You might
argue that as long as Levene’s test warns you that variances are not equal,
there is nothing to worry about. If we examine how often Levene’s test is significant,
we see it has a statistical power of only 63% with the sample sizes and
standard deviations in this example. Even though the variances in our
simulation are not equal, Levene’s test only reveals this difference in 63% of
the tests. The power depends on the size of the difference in variances (the
bigger, the higher the power), and on the sample size (the larger, the higher
the power). That is assuming that people check the assumptions of the t-test to begin with, and report Welch's test when Levene’s test is significant.
Unless you
have a very high power (and feel free to use the simulation to calculate what
your power would be, given your sample size, for a range of plausible standard
deviations), there is no way to be reasonably sure that variances are equal. If
we think about the masses that religiously chant ‘the null is always false’
(ahum, random assignment to conditions, anyone?) it is surprising that people
do not universally reject the idea that the variances in two condition are
equal. Unless you can convincingly argue the difference between groups does not
influence the standard deviation (good luck with that), it seems quite
reasonable to doubt this assumption.
If
variances are equal, Welch’s t-test
and Student’s t-test return the same p-value. But Type 1 error rates are only one factor to evaluate a test on. The second most important factor is statistical power (with ease of calculation being a third, but Welch's test is always reported in SPSS, so that's not a problem). If one test is much more powerful than the other, it can be considered a better test. Moser, Stevens, & Watts (1989) find that Student's t-test is only slightly more powerful when variances are equal but sample sizes are unequal. When the difference between sample sizes is huge (e.g., 20 vs 2000 participants) the Student's t-test is a few percent (e.g., 4%) more powerful. However, in most other situations, the difference in power is between 1 and 2 percent, which can be mitigated by just a few (sometimes even 1) additional participant(s) in the smaller group. The only other situation where the Student's t-test is more powerful is when variances and sample sizes are unequal and the larger group has the smaller variance, but in this situation, the Type 1 error rate is inflated in the Student's t-test, so it's not really an option anyway. These power differences are therefore not a strong reason to ever use Student's t-test instead of Welch's t-test, unless you can be confident variances are exactly equal.
The idea that a two-step procedure (first performing Levene's test, then deciding which test statistic to report) should be replaced by unconditionally reporting Welch's t-test is generally accepted by statisticians, but the fool-hardy stick-to-what-you-know ‘I’m not going to change if others are not changing’ researcher community seems a little slow to catch on. But not you.
The idea that a two-step procedure (first performing Levene's test, then deciding which test statistic to report) should be replaced by unconditionally reporting Welch's t-test is generally accepted by statisticians, but the fool-hardy stick-to-what-you-know ‘I’m not going to change if others are not changing’ researcher community seems a little slow to catch on. But not you.
If you have
made it to the end of this post, I know you care about doing things right. The
recommendation to always perform Welch’s t-test has not made it to all our
statistics textbooks yet, but it has made it to R, where Welch’s test is
returned by default (and Student’s t-test has to be requested by specifying
var.equal=TRUE). If you start reporting Welch’s t-test, you can reference Moser & Stevens, 1992 (non-paywalled version) who
explain why Welch’s test should always be used very clearly, or if you prefer a
strong statement, cite Ruxton, 2006 (open access) who says: “If you want to compare the
central tendency of 2 populations based on samples of unrelated data, then the
unequal variance t-test should always
be used in preference to the Student’s t-test
or Mann–Whitney U test.” (As long as data is normally distributed – if not, use
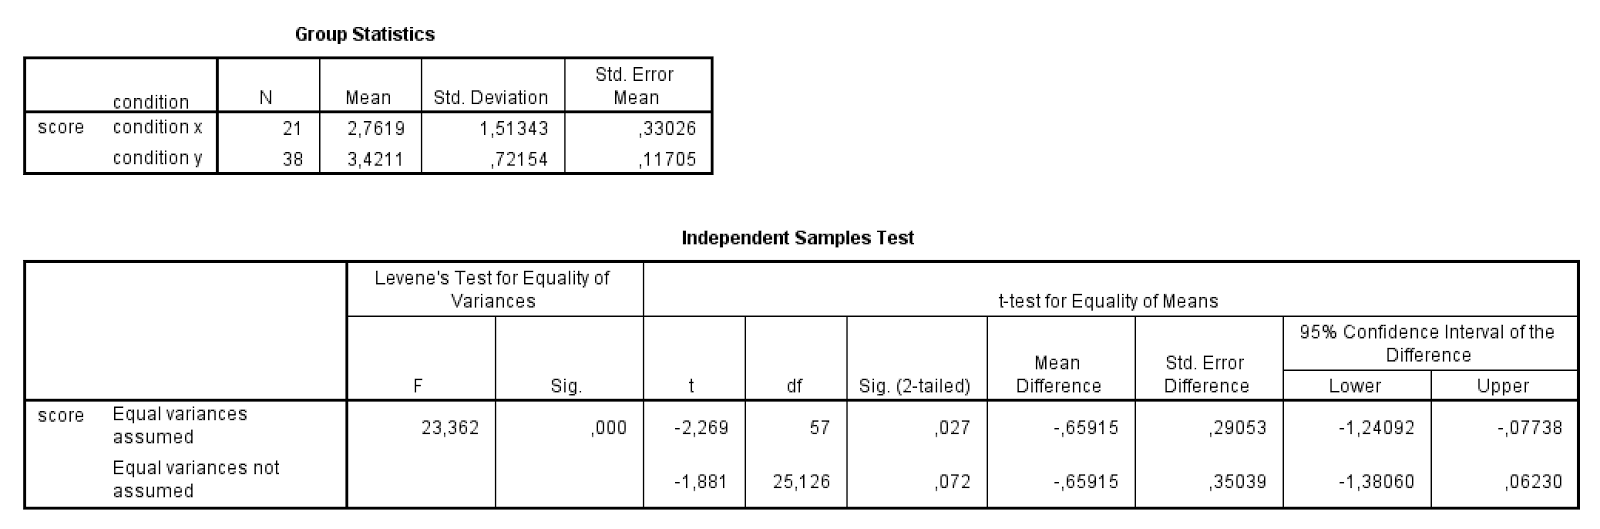
robust statistics, see Wilcox, 2012). Similarly, Hayes and Cai (2007, p. 237) conclude: "Our findings are consistent with those of others who have reported that the conditional decision rule serves little useful function and may as well be abandoned (Best & Rayner, 1987; Gans, 1981; Moser & Stevens, 1992; Wilcox et al., 1986)." It is not necessary to provide a reference if you use Welch's t-test, because it can easily be recognized by the different degrees of freedom it has, typically not a round number (e.g. not 57, but 25.13).
When you have unequal group sizes, and Welch’s t-test is significant but Student’s t-test is not, it is easy to make the correct choice. But next time you see the SPSS output below, stay strong. Always report Welch’s test for unequal variances.
When you have unequal group sizes, and Welch’s t-test is significant but Student’s t-test is not, it is easy to make the correct choice. But next time you see the SPSS output below, stay strong. Always report Welch’s test for unequal variances.
Still here? Then I guess you can handle the
formulas for Student’s t-test (mu’s
are the means, Sp is the pooled standard deviation, and n’s are the group sizes):
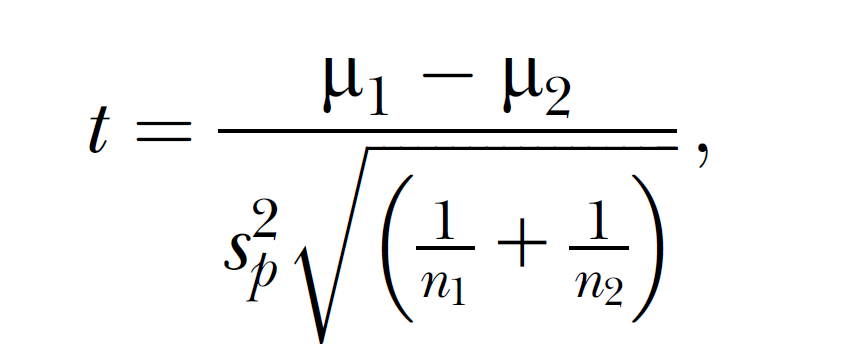
where the
pooled standard deviation is:

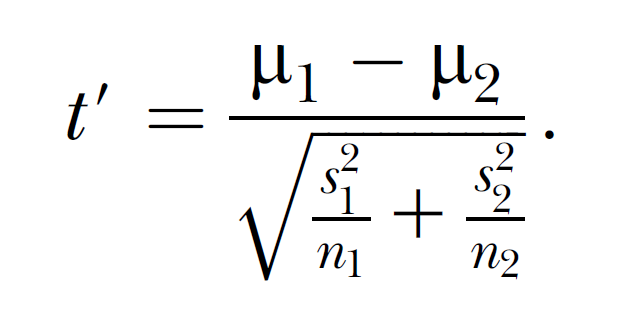
Welch’s t-test does not pool the standard
deviations, but divides the variance in each group by the size of that group,
as is clear from the formula below:
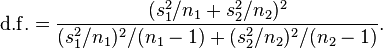
The formula for the degrees of freedom is known as the Welch-Sattertwaite-equation and is calculated by:
And finally, it is recommended to perform a Bayesian t-test to check whether any conclusions about rejecting the null-hypothesis converge with Welch’s t-test, and/or a robust t-test if you have reason to doubt that the data is normally distributed (an assumption that deserves its own blog post). For a practical introduction to robust statistics, see Wilcox, 2012.
Hi Daniel,
ReplyDeleteCool post! It reminded me a lot of this chart (http://rynesherman.com/T-Family.doc) I created in 2012. It displays all of the possible equations for T and their DF based on trimming (trim vs. no trim), variances (assume equality vs. do not assume equality), and number of means (two-sample case vs. more than two samples). Of course, it doesn't speak to repeated measures designs which is a different ball game.
The idea came to me after a summer school with Rand Wilcox (whom you cite) learning about various robust T-tests in R. I had nowhere to put the thing until your blog post! Thanks!
And now that you've got me thinking about it more, I actually have a function in my old list of function (not in my R package) called yuen.contrast() that lets one use any of those equations in the Table linked above. You are inspiring me to add it to my R package, so I am working on that now!
DeleteHey Daniel,
ReplyDeleteI liked your simulations and thought that scatter plot was a brilliant visualization of the difference between Welch and Student. I just have a couple of questions/thoughts I'd like to throw your way after reading this post. You may have considered these before, and feel free to tell me to be patient if there is a post in the pipeline to address them:
1) What implication does using Welch's test have on estimating effect sizes from our studies? Wider CIs, smaller ES estimates, or something else?
2) You say: "And finally, it is recommended to perform a Bayesian t-test to check whether any conclusions about rejecting the null-hypothesis converge with Welch’s t-test"
I'm not sure I understand this bit. Does this mean we should seek to verify if our conclusions using the Welch test are correct by using a bayesian test? Why don't we just report the bayesian test in the first place if that option is on the table?
3) Does doing a Welch test lead to doing anything differently when your p-values and bayes factors disagree, or do we defer to bayes as usual here? Or will they perhaps disagree less frequently using Welch tests?
And last one, I promise,
4) Isn't the p-value you get from the Welch test going to suffer from all the same problems (e.g., misinterpretation, adjustments for multiple comparisons, confusion when N gets very large, etc etc etc) of a regular old p-value? Our type-1 error rate will be better off swapping to Welch's test, no doubt about that, but there's still that elephant with the p shaped trunk in the room.
Interesting post as always, these were just my rambling thoughts too long for twitter :)
Hi,
Delete1) If the Type 1 error rate stays closer to the nominal value, this means the 95% CI's also stay closer to their nominal values. About ES - good point! I guess different SD's means Glass's delta (using the SD from one of the two conditions) is more appropriate than Cohen's d in some situations, but it was surprisingly enough never mentioned. I think there's a future paper in that question! My advice now would be to use a robust Cohen's d (I'll write about it in a future blog post). This blog is just an intro to robust statistics later on.
2) My idea here is simple: both approaches should (and will typically, except in huge N situations) agree (e.g., http://daniellakens.blogspot.nl/2014/09/bayes-factors-and-p-values-for.html). I want to improve the way we work, also for people who are not ready to switch to Bayes, and honestly, I think for practical purposes I don't care which test is reported. I only added the Bayesian t-test for the large N cases, and for situations where p-values are a little high (e.g p > 0.03). In those cases, Bayes will let you rethink (if you were not smart enough to take the huge N or weakness of high p-values into account yourself!).
3: When they disagree, replicate - neither test will be convincing. Both tests will agree (unless you have large samples, but since I believe p-values should be a decreasing function of sample size anyway.... http://daniellakens.blogspot.nl/2014/05/the-probability-of-p-values-as-function.html).
4) Yes. But I'm not the person convincing people to use Bayes, I'm trying to show them why what they are currently doing is suboptimal even if they don't use Bayes. :)
1-Thanks for answering :) i think I'm with you on the glass delta, and I'll be interested to hear about different robust effect size measures when you get around to writing about them.
Delete3-But what do we do if they disagree again once we replicate? Replicate again? But it's true they agree most of the time!
4-that's true, and it's worthwhile ;)
I agree that Levene's test serves no purpose. However, I am not convinced about the general recommendation to ‘always’ use the Welch test instead of the t test. The results of the present simulation are clear, but it seems quite rare to me that unequal variances will occur for normal distributions. Usually, unequal variances arise because of some floor or ceiling effect. I would recommend investigating such conditions too.
ReplyDeleteWhat is also not mentioned is the behavior of both tests for small sample sizes (something which the t test was originally developed for by ‘Student’).
Take n1=n2=2 and sd1=sd2=1. The type I error rate is 2.4% for the Welch test, while for the t test it is the nominal 5.0%. Now let us detect a difference of 8 (add 8 to one of the distributions). The power is now 67% for the Welch test and 96% for the t test. Of course, this small sample size is unusual. However, it does illustrate that is easy to come up with counterexamples where the Welch test does not work.
Hi Joost, yes, in tiny samples, power differences become more pronounced than 4%. But in your example (and as I note) adding one participant to the n=2 sample will mitigate the power differences (at least in one simulation I just ran). So if the difference in power can be solved by adding a single participant, I consider it practically unimportant. It's something people who like to run simulations might care about, but it is irrelevant for the researchers actually using statistics.
DeleteAnother reason I did not consider these situations is because doing inferential statistics on such small sample sizes is not very useful (http://daniellakens.blogspot.nl/2014/11/evaluating-estimation-accuracy-with.html).
More importantly, because your Levene's test will have such low power you will never be able to convince yourself variances are equal - I don't think you can provide a reference for your claim that unequal variances do not occur a lot in normal distributions. As I explain, the assumption is, in it's extreme form, practically untennable, and with different variances, Welch's test should be used.
But feel free to provide empirical support that variances are often equal, that would be very interesting.
Dear Daniel,
ReplyDeleteIt is possible to devise more counterexamples, even with normal distributions.
For example, with n1 = 30, n2 = 5, sd1 = 1.2, sd2 = 1, I get a Type II error rate of 5% for the t test and 10% for the Welch test (for detecting a mean shift of 2). The Type I error rate is 3% for the t test and 6% for the Welch test. So we now have a situation where the Welch t test performs twice as poorly as the t test regarding both power and false positives.
Best regards, Joost
Joost, you do seem to love ridiculously small sample sies despite my previous sttement that doing tatistics on such samples is not telling you more than flipping a coin. A type 1 error rate of 3% when you want it to be 5% means the test is performing poorly - so your example is demonstrating that Welch's test is performing better, but just don't realize it.
DeleteAlso, please provide those empirical references for your earlier statement that unequal variances are rare in normal distributions. Thanks.
DeleteFinally, in your example, as in the previous example, the power difference is mitigated by running one additional participant (so 6 instead of 5). Unless you have something with practical relevence to report, I'm sticking with my recommendation to alway report Welch's t-test.
DeleteDear Daniel,
ReplyDelete1) One could try other combinations using larger sample sizes (e.g., n1=100, n2=10, sd1=sd2=1), and this also shows that the t test can have a considerable power advantage (85% vs. 78% for a mean shift of 1). Anyway, I am unclear why you are saying that (n1=30, n2=5) is less informative than (n1=38, n2=22). Sometimes researchers are facing small sample sizes (and large effects). William Gosset developed the t test exactly because he was wanted to obtain valid results for small samples.
2) What I meant is NOT that unequal variances are rare IF you have normal distributions. What I meant is that unequal variances are usually accompanied by non-normal distributions. That is, unequal variances usually arise for some reason, such as a floor or ceiling measurement artefact. It would be interesting to explore how the Welch and t test compare in situations other than perfectly normal distributions.
For example, suppose one assumes a 5-point Likert scale, with the following density distribution: Totally disagree = 0%, Slightly disagree = 1%, Neutral = 3%, Slightly agree = 6%, Strongly agree = 90%, that is a highly skewed distribution. Also assume n1=22, n2=100. Now sample the two vectors from the same population. The Type I error rate is now 13% for the Welch test, and 4% for the t test. Of course, this is an extreme situation, but it nicely illustrates that the Welch test can break down completely if the distributional assumptions are violated.
3) I am also not sure whether the burden of proof should be on me now, while you are the one claiming that the Welch test should “always” be used. I just think you are making quite a generalization by saying that the Welch test is always preferred, because your conclusion seems to be based on 1 simulation using 1 set of parameters and 1 type of distribution. Counterexamples are easily found….
Cheers, Joost
Hi Joost,
DeleteI provide one example, and then reference an extensive literature that has examined this issue in detail, with a vast amount of different values, in hundreds of simulations, This is not my idea, it is not debated, I'm just explaining it. The references are there, so if you care enough about this topic to run simulations, read the literature I am summarizing.
There is a very specific set of effect size/sample size combination where Student's t-test has a little (but not enough to make it worthwhile) more power. This is discussed in the literature, and since you cannot be certain you have equal variances in tiny samples, you should always report Welch's t-test if you do science in the real world. I honestly don't care which specific combination you an come up with while running simulations in R where power values are a tiny bit in the advntage of Student's t.
Your latest example has pointed out a situation where I need to add 2 participants to the smallest group to compensate for the difference in power, and you are already entering the domain of underpowered studies (which I hope you are not recommending as good practice). If you want to perform even more underpowered studies, you can boost the difference between Student's t-test and Welch's t-test even more. But this all does not change the very simple fact that you should always report Welch's t-test (or, if data are not normal, robust statistics, such as Yuen's method, an adaptation on Welch's method using trimmed means and windsorized variances - but I'm leaving that for a future post).
Daniel; thanks for your extensive answers.
Delete"The R code below examines the Type 1 error rate of a hypothetical study where 38 participants were assigned to condition X, and 22 participants were assigned to condition Y. The mean score on some DV in both groups is the same (e.g., 0), so there is no effect, but the standard deviations between groups differ, with the SD in condition X being 1.11, and the SD in condition Y being 1.84."
ReplyDeleteWhat kind of experimental manipulation would lead to identical means but affect variance? And wouldn't the upshot of such a randomised experiment have to be that there was an effect - just not in terms of the mean.
I wholeheartedly agree that Levene's test (or test for normality or covariate balance for that matter) are overused in randomised experiments, and I also think that the Welch test is a better default than the normal t test in non-randomised experiments.
But doesn't randomisation allow us to boldly assume that 'null hypothesis = no effect' comprises both 'no mean shift' and> 'no change in variance', i.e. the assumption that both groups were drawn from the same population (whatever it may be)? (And use permutation tests while we're at it.)
I think these are good questions, that require data. Setting differences between means to 0, but assuming differences in variance is the only way to examine the Type 1 error rate of a test, but does it happen in practice. I think it might, depending on the field you work with, but it's really an empirical question.
DeleteThis comment has been removed by the author.
DeleteDepends on your H0. It's true if your H0 says 'mu 1 = mu 2' (i.e. two populations with the same mean), not if it says 'x1. and x2. are drawn from the same population'. If it's the latter H0 you're interested in (a decent choice given randomisation), you could actually make the case that the t-test (as well as the Mann-Whitney or permutation tests) outperforms the Welch test in detecting that the two populations are indeed different.
DeleteThis comment has been removed by the author.
ReplyDeleteAt first it seems to be quite a difficult story which will help in solving my problem but you are really very good things to clear the concepts and also it seems to be quite easy to understand now. how to run a manova in spss
ReplyDeleteYes! Statistics posts with references and simulations! Thanks!
ReplyDeleteIn you example, the data is normal, the variances are different but the means are the same. For my data on 4 or 6 different genotype groups, the data is not normal, the mean and variances are different between groups. I have chosen to log transform my data then perform Welch's test followed by Games-Howell post hoc test. Is it correct to transform data in such a way before carrying out a welch test or can you not say without more information on the dataset?
It is likely that my study has further problems, as the types of genetic crosses we do we give 4 or 6 genotypes where 1/8th of a population has the mutant genotype we wished to study, so low n and varied sample sizes are inevitable. As you say 'Student's t-test is more powerful when variances and sample sizes are unequal and the larger group has the smaller variance' but it affects the type I error rate, I am confused as to what whether Welch's would be the best option for me in such a case. Would you recommend a non-parametric test such as Kruskal-Wallis instead? But Kruskal-Wallis assumes the same shaped distrubution as far as I know, so would again not be correct for my data I beleive.
I was a bit worried about having to explain Welch's test in my Viva to an older generation of scientists, especially as a young medical statician had no idea what I was talking about recently. But I understand it much better now despite still having confusions about my own data!
Thanks
Dee
This comment has been removed by a blog administrator.
ReplyDeleteThank you for this valuable information, it is really useful.
ReplyDeleteHey, out of curiosity, what about in cases where you are using an ANOVA with either one or multiple predictors?
ReplyDelete
ReplyDeleteHow to kiss the other party the most impressed.
คาสิโนออนไลน์ Betting Online Betting Sites It is part of the online players. Get into online betting. It is a popular game of all kinds of gambling games. It very good Can receive news More news. Love show To impress people who love themselves. Whether it is a woman or a man. There are always different ways to express love. Some people choose to say "love" to express their feelings to the other party to know. But some people choose to act in body language, express themselves more deeply and show more love.
Gently kisses the forehead for bright love. I used to say fans. Everything in life is happy and pink. The man kisses her forehead gently. It shows the love and affection he has for women. Women will feel warmth and safest. For the first kiss should show a love that is not very much. Most of the love is more expressive.
Kissing is a way of expressing love without mistakes. But do not be blatant or do it in a crowded place. It should be done in a private place where only you and your loved ones. Making an impression of kissing is not difficult. It is believed that the power of love, whether it is a kiss, it is always happy for online casinos. The exciting game has given us a chance to diversify our services. Interesting game It is another game that will advance to the online betting service that has continuous betting. Games to Employees to Thai Society of Games คาสิโนออนไลน์
OK, now I'm getting nervous. The F statistic in one-way ANOVA uses the MSE as its denominator, and that's just pooled variance on steroids. Should we re-think the F test with more carefully designed factors?
ReplyDeleteThere's also a Welch's version of ANOVA. This blog post provides a short discussion: https://statisticsbyjim.com/anova/welchs-anova-compared-to-classic-one-way-anova/
DeleteThis comment has been removed by a blog administrator.
ReplyDeleteThis comment has been removed by a blog administrator.
ReplyDeleteThanks so much for the informative blog.
ReplyDelete