You might have seen the ‘Dance of the p-values’ video by Geoff Cumming (if not, watch it here). Because p-values and the default Bayes factors (Rouder, Speckman, Sun, Morey, & Iverson, 2009) are both calculated directly from t-values and sample sizes, we might expect there is also a Dance of the Bayes factors. And indeed, there is. Bayes factors can vary widely over identical studies, just due to random variation.
If people would always correctly interpret Bayes factors,
that would not be a problem. Bayes factors tell you how much data are in line
with models, and quantify relative evidence in favor of one of these models.
The data is what it is, even when it is misleading (i.e., supporting a hypothesis that is not true). So, you can conclude the null model is more likely than some other model, but purely
based on a Bayes factor, you can’t draw a conclusion such as “This Bayes factor
allows us to conclude that there are no differences between conditions”. Regrettably, researchers are
massively starting to misinterpret Bayes factors (I won't provide references, though I have many). This is not surprising –
people find statistical inferences difficult, whether these are about p-values, confidence intervals, or Bayes
factors.
As a consequence, we see many dichotomous absolute interpretations
(“we conclude there is no effect”) instead of continuous relative
interpretations (“we conclude the data increase our belief in the null model
compared to the alternative model”). As a side note: In my experience some people who advocate Bayesian statistics over NHST often live in
a weird Limbo. They believe the null is never true when they are criticizing Null-Hypothesis
Significance Testing as a useless procedure because we already know the null is
not true, but they love using Bayes factors to conclude the null-hypothesis is
supported.
For me, there is one important difference between the
dance of the p-values and the dance
of the Bayes factors: When people draw dichotomous conclusions, p-values allow you to control your error
rate in the long run, while error rates are ignored when people use Bayes factors. As a consequence, you can
easily conclude there is ‘no effect’, where there is an effect, 25% of the
time (see below). This is a direct consequence of the ‘Dance of the Bayes factors’.
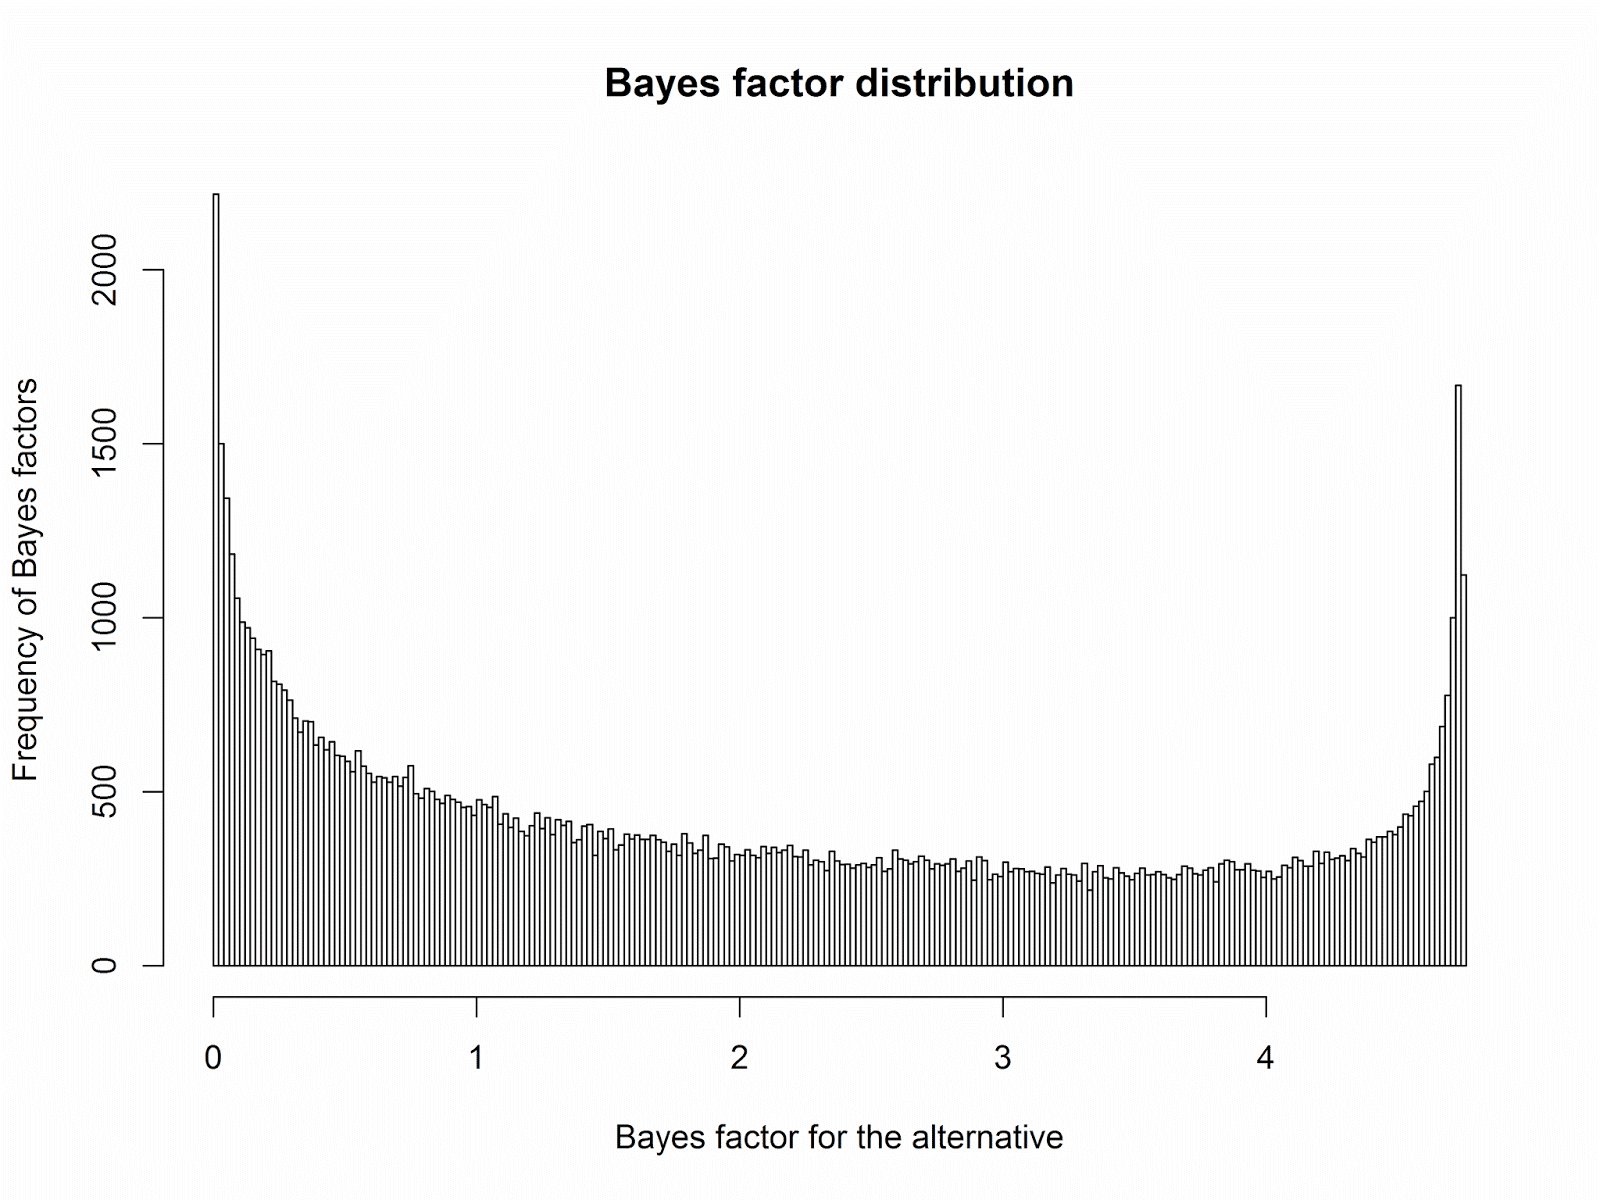
Let’s take the following scenario: There is a true small
effect, Cohen’s d = 0.3. You collect
data and perform a default two-sided Bayesian t-test
with 75 participants in each condition. Let’s repeat this 100.000 times, and
plot the Bayes factors we can expect.
If you like a more dynamic version, check the ‘Dance of the
Bayes factors’ R script at the bottom of this post. As output, it gives you a :D smiley when you have
strong evidence for the null (BF < 0.1), a :) smiley when you have moderate
evidence for the null, a (._.) when data is inconclusive, and a :( or :(( when
data strongly support the alternative (smileys are coded based on the
assumption researchers want to find support for the null). See the .gif below
for the Dance of the Bayes factors if you don’t want to run the script.

I did not choose this example randomly (just as Geoff
Cumming did not randomly choose to use 50% statistical power in his ‘Dance of
the p-values’ video). In this
situation, approximately 25% of Bayes factors are smaller than 1/3 (which can
be interpreted as support for the null), 25% are higher than 3 (which can be
interpreted as support for the alternative), and 50% are inconclusive. If you
would conclude, based on your Bayes factor, that there are no differences
between groups, you’d be wrong 25% of the time, in the long run. That’s a lot.
(You might feel more comfortable using a BF of 1/10 as a
‘strong evidence’ threshold: BF < 0.1 happen 12.5% of the time in this simulation. A BF > 10
never happens: We don't have a large enough sample size. If your true effect size is 0.3, you have decided to collect a maximum of 75
participants in each group, and you will look at the data repeatedly until you have
‘strong evidence’ (BF > 10 or BF < 0.1), you will never observe support for
the alternative, and you can only observe strong evidence in favor of the null
model, even though there is a true effect).
Felix Schönbrodt gives some examples for the probability you
will observe a misleading Bayes factor for different effect sizes and priors (Schönbrodt,
Wagenmakers, Zehetleitner, & Perugini, 2015). Here, I just want note you might want to take the Frequentist properties of Bayes factors in to account, if you
want to make dichotomous conclusions such as ‘the data allow us to conclude
there is no effect’. Just as the ‘Dance of the p-values’ can be turned into a ‘March of the p-values’ by increasing the statistical power, you can design
studies that will yield informative Bayes factors, most of the time (Schönbrodt
& Wagenmakers, 2016). But you can only design informative studies, in
the long run, if you take Frequentist properties of tests into account. If you
just look ‘at the data at hand’ your Bayes factors might be dancing around. You
need to look at their Frequentist properties to design studies where Bayes
factors march around. My main point in this blog is that this is something you
might want to do.
What’s the alternative? First, never make incorrect dichotomous
conclusions based on Bayes factors. I have the feeling I will be repeating this
for the next 50 years. Bayes factors are relative evidence. If you want to make
statements about how likely the null is, define a range of possible priors, use
Bayes factors to update these priors, and report posterior probabilities as your explicit subjective belief in the null.
Second, you might want to stay away from the default priors.
Using default priors as a Bayesian is like eating a no-fat no-sugar no-salt
chocolate-chip cookie: You might as well skip it. You will just get looks of sympathy
as you try to swallow it down. Look at Jeff Rouder’s post on how
to roll your own priors.
Third, if you just want to say the effect is smaller than
anything you find worthwhile (without specifically concluding there no effect) equivalence
testing might be much more straightforward. It has error control, so you
won’t incorrectly say the effect is smaller than anything you care about too
often, in the long run.
The final alternative is just to ignore error rates. State
loudly and clearly that you don’t care about Frequentist properties. Personally,
I hope Bayesians will not choose this option. I would not be happy with a
literature where thousands of articles claim the null is true, when there is a
true effect. And you might want to know how to design studies that are likely
to give answers you find informative.
When using Bayes factors, remember they can vary a lot across identical studies. Also remember that Bayes factors give you relative
evidence. The null model
might be more likely than the alternative, but both models can be wrong. If the true effect size is 0.3, the data might be closer to a value of 0 than
to a value of 0.7, but it does not mean the true value is 0. In Bayesian
statistics, the same reasoning holds. Your data may be more likely under a null
model than under an alternative model, but that does not mean there are no
differences. If you nevertheless want to argue that the null-hypothesis is true
based on just a Bayes factor, realize you might be fooling yourself 25% of the time.
Or more. Or less.
References
- Rouder, J. N., Speckman, P. L., Sun, D., Morey, R. D., & Iverson, G. (2009). Bayesian t tests for accepting and rejecting the null hypothesis. Psychonomic Bulletin & Review, 16(2), 225–237. http://doi.org/10.3758/PBR.16.2.225
- Schönbrodt, F. D., Wagenmakers, E. J., Zehetleitner, M., & Perugini, M. (2015). Sequential Hypothesis Testing With Bayes Factors: Efficiently Testing Mean Differences. Psychological Methods. Retrieved from http://www.ncbi.nlm.nih.gov/pubmed/26651986
- Schönbrodt, F. D., & Wagenmakers, E.-J. (2016). Bayes Factor Design Analysis: Planning for Compelling Evidence (SSRN Scholarly Paper No. ID 2722435). Rochester, NY: Social Science Research Network. Retrieved from http://papers.ssrn.com/abstract=2722435